Domestic Water Pressure Booster Sizing Part 4: Determining Pipe Friction Loss
/Today is a big day. We are about to complete our Pressure Booster Selection Procedure worksheet so we can select a pressure booster. But before we do that, let’s do a quick review of the building example we’ve been using throughout this short series.
Building Characteristics
• 10 stories high, 115 ft tall, 10 apartments per floor
• Fixture units per apartment: 8 units, consisting of,
- One Bathroom w/Flush Tank and Separate Shower (private) = 6 F.U.
- Kitchen Sink - Private = 2 F.U.
For a total of 8 F.U. per apartment and 800 F.U. for the whole building.
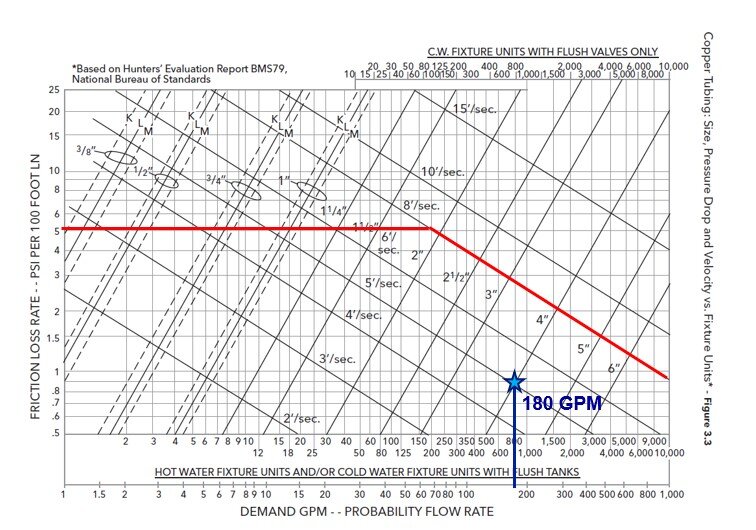
Based on the Hunters Curve we have a maximum demand of 180 GPM
• Most critical feature: Flush tanks are used and require 20 psig at top
• In this application a backflow preventer and water meter are required at the city water inlet to the building.
The underlined information above tells us what we need to calculate the pipe friction loss, along with capturing device pressure drops so we can determine the total system pressure boost required.
Sizing the Pipe
To calculate the total pipe friction loss, we first need to size the pipe using the chart below. This chart, created by Bell & Gossett, is based on Hunter’s data and can be used for domestic water pipe sizing. It gives us the friction loss rates for copper piping at various sizes, along with corresponding GPM demand.
When sizing copper pipe you want to remain under 5 PSI per 100 ft pressure drop and 8 ft per second velocity (see the red line on the chart). Compared to pressure drops for hydronic HVAC systems, 5 PSI per 100 ft might seem excessive but keep in mind we are sizing for a peak demand which will not happen often. The reason for limiting the velocity to 8 ft. per second is because of noise.
With all this in mind, we find our 180 GPM at the bottom of the chart and draw a line up vertically to where it intersects with either the 5 PSI per 100 ft horizontal red line or the 8 ft per second diagonal red line that runs from the upper left to the bottom of the chart.
In this example we would go with 4-inch pipe which has a pressure drop around 0.8 PSI per 100 ft. Why would we not choose 3-inch pipe? Because if we continue to draw the line vertically from 180 GPM till it intersects with the 3-inch pipe curve then the velocity is above 8 ft per second threshold.
(Note that while some of us like our charts, most of you will be using one of the many pipe sizing applications that are available for free, such as the Bell& Gossett System Syzer. These apps include a wide range of pipe sizes, along with options for various types of pipe, including PVC, and fluids other than water.)
A conservative approach is to size the pipe according to the above criteria then apply a 5 PSI pressure drop to the longest run of pipe. For simplicity sake, let’s say our longest pipe run is 100, giving us exactly 5 PSI of friction lost. As a general rule of thumb, we add 20% to that for tees, elbows and fittings, giving us a horizontal pipe friction loss of 6 PSI.
Finally, we have a backflow and a water meter on our system. Backflow preventers are typically 10 to 12 PSI, so we plug in 12 PSI for that to be safe. Water meters typically have 5 to 8 PSI of loss, so we plug in 8 PSI.
Now we have all we need to do is complete the below chart to determine our system pressure boost. In our next article we will select the pressure booster!